PRODUCT
고객님께 적합하고 효율적인 최선의 솔루션을 제안하겠습니다.
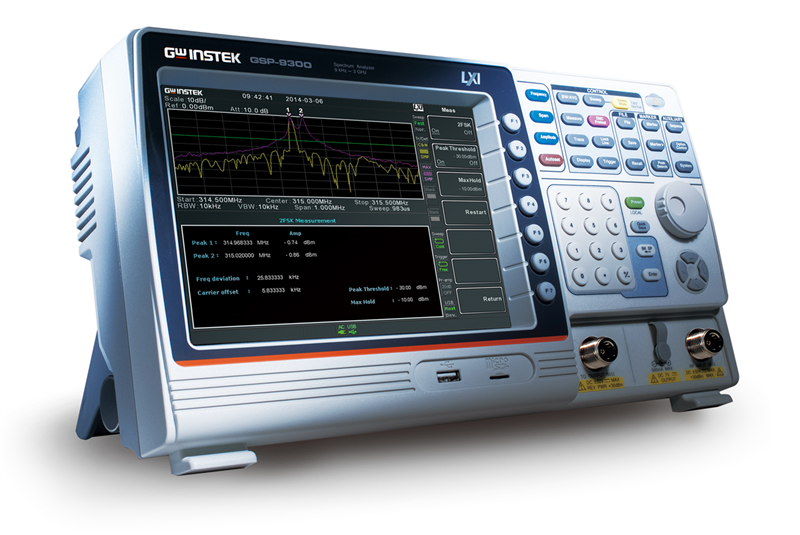
gwinstek>>Gwinstek>>GSP-9300
|
주요특징 |
|
|
|
|
 주파수 범위 : 9kHz~3GHz
|
Measurement Function Key Features |
|
|
Fast Sweep Mode GSP-9300 supports the fast sweep mode with sweep speed up to 307usec. Users can use the fast sweep mode to capture transient signals such as Tire-pressure monitoring system (TPMS), Bluetooth frequency hopping signals, tuned oscillator, and other interfering signals in ISM frequency band, etc. |
|
 |
2FSK Signal Analysis 2FSK modulation, for its features of low design cost and low electricity consumption, is widely used by RF communications applications with low power and low data transmission speed characteristics. Nowadays, 2FSK modulation technology has been applied in various products and systems such as consumer electronics, automotive electronics, RFID, auto reading electricity meter, and industrial control devices, etc. |
|
ASK/FSK Signal Demodulation & Analysis RFID and optical communications systems often use Amplitude Shift Keying (ASK). Applications such as wireless telephone, paging systems, and RFID, etc. utilize Frequency Shift Keying (FSK). |
|
|
|
 FSK Analyzer |
|
AM/FM Signal Demodulation & Analysis AM/FM Signal Analysis measures parameters including AM depth, frequency deviation, modulation rate, carrier power, carrier frequency offset and SINAD. Users can set the criterion in AM depth, frequency deviation, carrier power and carrier offset for fast test result determination. |
|
|
|
 FM Analyzer |
|
EMC Pretest Mode EMC pretest mode is ideal for electromagnetic compatibility (EMC) test which is the preliminary stage of electronics product development. Users can identify and resolve problems at the early phase to avoid product revision after it was finalized. Hence, product development cycle and cost will be greatly reduced which is beneficial to saving cost and time for product entering the verification stage. |
|
|
|
 EMS Pretest |
|
Spectrogram Spectrogram can simultaneously display power, frequency, and time. Frequency and power variation according to time changes can also be tracked. Especially, the intermittently appeared signals can be identified. Users, by using Spectrogram, can analyze the stability of signal versus time or identify the intermittently appeared interference signals in the communications system. Users can use two markers to find out the relation of power to frequency and time. |
 |
 |
Topographic Topographic uses color shade to show the probability distribution of signal appearance. This function allows users to directly understand the process of signal variation according to time changes that is beneficial to observe intermittent feeble signals or electromagneticinterference signals. Users can use two makers to find out the relation of power to frequency and percentage. |
|
Gated Sweep Radar or TDMA communications systems, via intermittently turning on/off output power, control transmission signals. In order to monitor the power spectrum during the transmission process, the Gated Sweep function can initiate measurement only when signals appear. This function is ideal for measuring burst signals such as GSM or WLAN (as shown in the example).
|
 |
 |
OCBW ( Occupied Bandwidth ) The OCBW measurement can simultaneously display OCBW, channel power and PSD. OCBW’s unit is shown by percentage. A measurement area containing bandwidth will be shown when OCBW is in use. |
|
ACPR ( Adjacent Channel Power Ratio ) Telecommunications and broadcasting service carriers must reduce interference to the minimum. This interference is caused by power leakage to adjacent transmission channels. The ACPR measurement can examine the leakage status that is conducive to identifying interference source. |
 |
 |
SEM ( Spectrum Emission Mask ) SEM measures out-of-channel emission which is defined by corresponding in-channel power. Users can set main channel’s parameters, out-of-channel range, and limit line, etc. SEM supports the Pass/Fail test function and lists frequency range for surpassing each out-of-channel limit. An alarm signal will be triggered if any measurement results that are not matched with SEM. GSP-9300 has the built-in SEM settings of 3GPP, WLAN 802.11b/g/n, Wimax 802.16 and self-defined communications system. |
|
TOI ( Third Order Intercept ) Users can measure the linearity of non-linear systems and components such as receiver, low-noise amplifier and mixer by TOI which automatically tests effective carrier and measures inter-modulation sidebands. |
 |
 |
Harmonic Harmonic can easily measure the amplitude of fundamental frequency and as high as ten orders of harmonic frequency. This function can also measure amplitude (dBc) which is the ratio of harmonic and corresponding fundamental carrier. Total harmonic distortion (THD) can also be calculated by this function. |
|
Time Domain Power Users can go to zero span setting and open marker to observe burst signals when measuring burst signal in time domain is required. |
 |
 |
Phase Jitter The Phase Jitter function can rapidly measure phase noise produced by RF signal source’s and oscillator’s carrier deviation. This function can directly convert signal jitter to phase (rad) and time (ns). |
|
CNR/CSO/CTB The built-in CNR/CSO/CTB functions of GSP-9300 are ideal for measuring performance of CATV amplifier and system. |
 |
 |
Frequency Counter The frequency counter function is used to make accurate frequency measurements up to 1Hz resolution. |
|
Marker Noise The marker noise function calculates the average noise level over a bandwidth of 1Hz, referenced from the marker position. |
 |
|
Production Line Key Features |
|
|
Shorten Warm-Up Time GSP-9300 utilizes the patented design of high efficient heat dissipation and feedback temperature control. After the instrument is turned on, the internal instrument can rapidly maintain a stable temperature so as to provide accurate amplitude measurement and deliver the frequency measurement with 0.025ppm frequency stability. |
|
|
Wake-Up Clock Users can set up automatic wake-up time for each day of the week. By so doing, the purpose of GSP-9300 pre wake-up can be achieved. Pre wake-up is ideal for the lower temperature environment to conduct tests in the preset time. |
 |
 |
Sequence Function The sequence function allows users to edit a sequence formulated by a series of steps directly from the instrument. Pause and delay can be inserted in the sequence to observe the test results. There are five sets of sequence for selection. Each sequence allows editing of 20 steps. Different sequence can be interactive and support each other. This function provides automatic editing without using the PC that is very convenient for assembly lines in which execute routine test procedures. |
|
Limit Line Function The limit line function, based upon the preset criteria of passing the test, can be used to directly determine whether the DUT passes the test. |
 |
 |
Various Interface GSP-9300 provides instrument control interface including LAN, RS-232, USB, and GPIB (optional). |
|
Options |
|
|
Scalar Network Analysis The built-in tracking generator can swiftly and easily measure frequency response of cable loss, filter bandwidth, amplifier gain, mixer conversion loss, etc. The N-dB Bandwidth function measures 3dB bandwidth of Bandpass filter. SWR bridge should be connected with tracking generator to measure the return loss of antenna or filter. |
|
 3dB Bandwidth |
 3dB Bandwidth |
|
P1dB Point Measurement All active components have linear dynamic range for power output. Once output power reaches the maximum level, active component will enter the non-linear saturated area of P1dB point and cease amplifying signal intensity as well as produce harmonic distortion. It is very useful for P1dB point measurement in active components such as low noise amplifier, mixer and active filter. |
 |
 |
Power Meter GSP-9300 not only collects, displays, and stores the measurement results of power meter, but also provides the Pass/Fail function. |
|
Battery Pack Compact and light-weighted (4kg) GSP-9300 can be powered by battery making it suitable for outdoor operations. Optional GSP-9300 battery pack (opt.02) has a battery life of two hours. Optional soft carrying case (GSC-009) provides convenience and protection to the instrument. GSP-9300 is equipped with 8.4 inches 800x600 pixels LCD display which yields clearer display results for outdoor operations. |
|
|
User Friendly Design |
|
|
Status Icons Status Icons show the interface status, power status, alarm status and etc of GSP-9300. Users can easily understand the setting status and test results of the instrument. |
 |
 |
Definition Help The built-in Definition Help function allows users to immediately understand the parameters of Channel Power, OCBW, ACPR, SEM, Phase Jitter, N-dB Bandwidth & P1dB items so as to save time on reading user manual. |
|
External PC Software & Driver Support |
|
|
SpectrumShot Software Users can use the external software SpectrumShot for EMI test report management and assessment, remote control and waveform data recording for long periods of time. |
|
 |
|
|
Under Get Trace mode, users can record the waveform data for long periods of time. It can be applied to spectrum monitoring for detecting any abnormal radio signals. The software will send out e-mail to inform users if any abnormal situation occurs. |
|
 |
|
|
Under the Remote Control mode, users can monitor wireless interference signals or observe signals for long periods of time. |
|
 |
|
|
IVI Driver IVI Driver Supports LabView & LabWindows/CVI Programming. It is available on NI website. |
|
|
GSP-9300 Remote Control APP Users can install the “GSP-9300 Remote Control” APP on an Android Smart Phone or Tablet. |
|


|
GSP-930 Specification |
|
|
Frequency |
|
|
Frequency Range |
9 kHz to 3.0 GHz |
|
Frequency Reference |
|
|
Accuracy |
±[(period since last adjustment X aging rate) + stability over temperature + supply voltage stability |
|
Frequency Readout Accuracy |
|
|
Start, Stop, Center, Marker |
±(marker frequency indication X frequency reference accuracy + 10% x RBW + frequency resolution1) |
|
Marker Frequency Counter |
|
|
Resolution |
1 Hz, 10 Hz, 100 Hz, 1 kHz |
|
Frequency Span |
|
|
Range |
0 Hz (zero span), 100 Hz to 3 GHz |
|
Phase Noise |
|
|
Offset from Carrier |
Fc =1 GHz; RBW = 1 kHz, VBW = 10 Hz;Average ≥ 40 |
|
Resolution Bandwidth (RBW) Filter |
|
|
Filter Bandwidth |
1 Hz to 1 MHz in 1-3-10 sequence ; -3dB bandwidth |
|
Video Bandwidth (VBW) Filter |
|
|
Filter Bandwidth |
1 Hz to 1 MHz in 1-3-10 sequence ; -3dB bandwidth |
|
Amplitude Range |
|
|
Measurement Range |
100 kHz to 1 MHz ; Displayed Average Noise Level (DANL) to 18 dBm |
|
Attenuator |
|
|
Input Attenuator Range |
0 to 50 dB, in 1 dB step ; Auto or manual setup |
|
Maximum Safe Input Level |
|
|
Average Total Power |
≤ 33 dBm ; Input attenuator ≥10 dB |
|
1 dB Gain Compression |
|
|
Total Power at 1st Mixer |
> 0 dBm ; Typical, Fc ≥50 MHz, preamp. off |
|
Displayed Average Noise Level (DANL)4 |
|
|
Preamp off |
0 dB attenuation; RBW 10 Hz; VBW 10 Hz; span 500 Hz; reference level = -60dBm; trace average ≥ 40 |
|
Level Display Range |
|
|
Scales |
Log, Linear |
|
Absolute Amplitude Accuracy |
|
|
Absolute Point |
Center=160 MHz ; RBW 10 kHz; VBW 1 kHz; span 100 kHz; log scale;1 dB/div; peak detector; 20 to 30°C; signal 0 dBm |
|
Frequency Response |
|
|
Preamp off |
Attenuation: 10 dB; Reference: 160 MHz; 20 to 30°C |
|
Attenuation Switching Uncertainty |
|
|
Attenuator setting |
0 to 50 dB in 1 dB step |
|
RBW Filter Switching Uncertainty |
|
|
1 Hz to 1 MHz |
± 0.25 dB ; reference : 10 kHz RBW |
|
Level Measurement Uncertainty |
|
|
Overall Amplitude Accuracy |
± 1.5 dB ; 20 to 30°C; frequency > 1 MHz; Signal input 0 to -50 dBm; |
|
Spurious Response |
|
|
Second Harmonic Intercept |
Preamp off; signal input -30dBm; 0 dB attenuation |
|
Sweep Time |
|
|
Range |
22 ms to 1000 s ; Span ≥ 100Hz |
|
RF Preamplifier (installed as standard) |
|
|
Frequency Range |
1 MHz to 3 GHz |
|
RF Input |
|
|
Connector Type |
N-type female |
|
Power for Option |
|
|
Connector Type |
SMB male |
|
USB Host |
|
|
Connector Type |
A plug |
|
MicroSD Socket |
|
|
Protocol |
SD 1.1 |
|
Reference Output |
|
|
Connector Type |
BNC female |
|
Reference Input |
|
|
Connector Type |
BNC female |
|
Alarm Output |
|
|
Connector Type |
BNC female; Open-collector |
|
Trigger Input/ Gated Sweep Input |
|
|
Connector Type |
BNC female |
|
LAN TCP/IP Interface |
|
|
Connector Type |
RJ-45 |
|
USB Device |
|
|
Connector Type |
B plug ; For remote control only; supports USB TMC |
|
IF Output |
|
|
Connector Type |
SMA female |
|
Video Output |
|
|
Connector Type |
DVI-I ( integrated analog and digital) , Single Link ; Compatible with VGA or HDMI standard through adapter |
|
RS232 Interface |
|
|
Connector Type |
D-sub 9-pin female ; Tx,Rx,RTS,CTS |
|
GPIB Interface (Optional) |
|
|
Connector Type |
IEEE-488 bus connector |
|
AC Power Input |
|
|
Power Source |
AC 100 V to 240 V, 50 / 60 Hz ; Auto range selection |
|
Battery Pack (Optional) |
|
|
Battery pack |
6 cells, Li-Ion rechargeable, 3S2P ; With UN38.3 Certification |
|
General |
|
|
Internal Data storage |
16 MB nominal |
|
Tracking Generator5 (Optional) |
|
|
Frequency Range |
100 kHz to 3 GHz |
|
|
|
|
Type |
USB cable to GSP9300 Front-Panel USB Host |
|
Power Measurement |
* -30 dBm to +5 dBm: |